Electrify Chicago
According to the
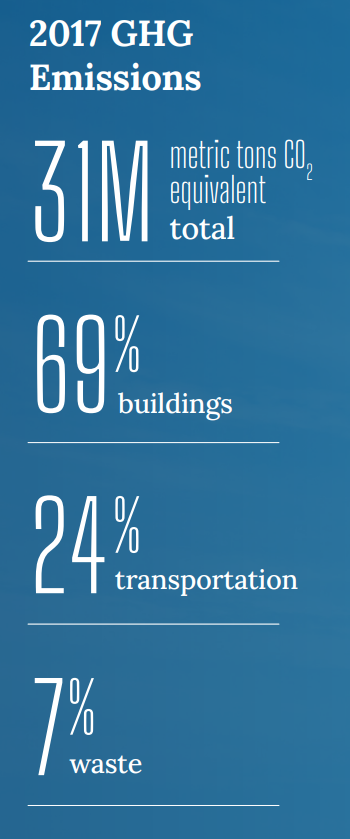
2022 Chicago Climate Action Plan ,
a whopping 69% of Chicago's emissions come from buildings, making it
our biggest challenge and our biggest opportunity as a city to tackle
change. At Electrify Chicago we want to showcase some of the best and worst performing
buildings in the city using publicly available data and manual annotations to add
building photographs and label multi-building owners like universities.
,
a whopping 69% of Chicago's emissions come from buildings, making it
our biggest challenge and our biggest opportunity as a city to tackle
change. At Electrify Chicago we want to showcase some of the best and worst performing
buildings in the city using publicly available data and manual annotations to add
building photographs and label multi-building owners like universities.
You can start by looking at Chicago's buildings with the highest greenhouse gas intensity - this means that they use the most energy when adjusted per unit of square foot, so big buildings could actually perform much better than very inefficient small buildings on this metric.
Chicago Buildings by Greenhouse Gas Intensity
Note: Data only includes large Chicago buildings from 2020
Note: This data only includes buildings whose emissions are reported
under the
Chicago Energy Benchmarking Ordinance. According to the City “As of 2016,
this list includes all commercial, institutional, and residential buildings larger than
50,000 square feet.” This dataset is also then filtered to only buildings with
reported emissions > 1,000 metric tons CO2 equivalent.
This data is also from 2020, but when new benchmark data is available, we'll update the site.
| Property Name / address | Primary Property Type |
Greenhouse Gas Intensity (kg CO2 eq./sqft) |
Total Greenhouse Emissions (metric tons CO2 eq.) |
|---|---|---|---|
|
Norwegian American Hospital
1044 N Francisco Ave
| Hospital (General Medical & Surgical) | 22.1 kg/sqft
Highest 7%
| 6,904 tons
Highest 10%
|
|
John G Shedd Aquarium
📷
1200 S Lake Shore Dr
| Other | 22.1 kg/sqft
Highest 7%
| 9,989 tons
Highest 6%
|
|
Presence SMEMC St Mary Campus
🚩
2233 W Division St
| Hospital (General Medical & Surgical) | 22.1 kg/sqft
Highest 7%
| 15,415 tons #39 Highest
|
|
NMH Prentice Womens Hospital
🚩
250 E Superior St
| Hospital (General Medical & Surgical) | 22.0 kg/sqft
Highest 7%
| 20,820 tons #20 Highest
|
|
Jewel Osco, 03296-Foster & Harlem
7342 W Foster Ave
| Supermarket/Grocery Store | 21.9 kg/sqft
Highest 7%
| 1,690 tons
Lowest 37%
|
|
Gateway Centre
7451 7521 N CLARK ST
| Retail Store | 21.7 kg/sqft
Highest 7%
| 1,692 tons
Lowest 37%
|
|
Hotel Palomar Chicago
505 N State St
| Hotel | 21.6 kg/sqft
Highest 8%
| 2,341 tons
Highest 42%
|
|
2200 S Western Ave
2200 S Western Ave
| Supermarket/Grocery Store | 21.6 kg/sqft
Highest 8%
| 1,404 tons
Lowest 24%
|
|
832 854 W FULTON MARKET
832 854 W FULTON MARKET
| Mixed Use Property | 21.5 kg/sqft
Highest 8%
| 2,075 tons
Highest 49%
|
|
Robert J Stein Institute of Forensic Medicine
2121 W Harrison St
| Other - Public Services | 21.3 kg/sqft
Highest 8%
| 1,692 tons
Lowest 37%
|
|
United Airlines Reservation Center
11555 W Touhy Ave
| Office | 21.2 kg/sqft
Highest 8%
| 2,594 tons
Highest 37%
|
|
Loyola Park
🏆
1230 W Greenleaf Ave
| Other - Recreation | 21.2 kg/sqft
Highest 8%
| 1,190 tons
Lowest 14%
|
|
600 618 S WABASH AVE
600 618 S WABASH AVE
| Residence Hall/Dormitory | 20.9 kg/sqft
Highest 8%
| 1,993 tons
Lowest 48%
|
|
Costco
2746 N Clybourn Ave
| Supermarket/Grocery Store | 20.9 kg/sqft
Highest 8%
| 2,982 tons
Highest 31%
|
|
Ann & Robert H. Lurie Children's Hospital of Chicago
🚨
225 E Chicago Ave
| Hospital (General Medical & Surgical) | 20.9 kg/sqft
Highest 8%
| 26,971 tons #10 Highest
|
Data Source:
Chicago Energy Benchmarking Data