Electrify Chicago
According to the
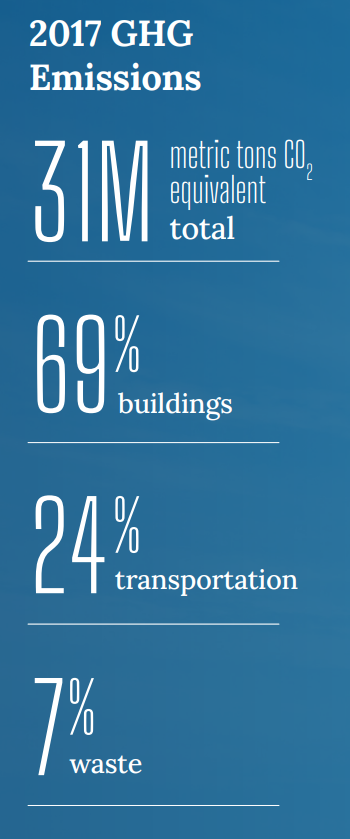
2022 Chicago Climate Action Plan ,
a whopping 69% of Chicago's emissions come from buildings, making it
our biggest challenge and our biggest opportunity as a city to tackle
change. At Electrify Chicago we want to showcase some of the best and worst performing
buildings in the city using publicly available data and manual annotations to add
building photographs and label multi-building owners like universities.
,
a whopping 69% of Chicago's emissions come from buildings, making it
our biggest challenge and our biggest opportunity as a city to tackle
change. At Electrify Chicago we want to showcase some of the best and worst performing
buildings in the city using publicly available data and manual annotations to add
building photographs and label multi-building owners like universities.
You can start by looking at Chicago's buildings with the highest greenhouse gas intensity - this means that they use the most energy when adjusted per unit of square foot, so big buildings could actually perform much better than very inefficient small buildings on this metric.
Chicago Buildings by Greenhouse Gas Intensity
Note: Data only includes large Chicago buildings from 2020
Note: This data only includes buildings whose emissions are reported
under the
Chicago Energy Benchmarking Ordinance. According to the City “As of 2016,
this list includes all commercial, institutional, and residential buildings larger than
50,000 square feet.” This dataset is also then filtered to only buildings with
reported emissions > 1,000 metric tons CO2 equivalent.
This data is also from 2020, but when new benchmark data is available, we'll update the site.
| Property Name / address | Primary Property Type |
Greenhouse Gas Intensity (kg CO2 eq./sqft) |
Total Greenhouse Emissions (metric tons CO2 eq.) |
|---|---|---|---|
|
Press Office Building
1427 E 60th St
| Office | 11.1 kg/sqft
Highest 24%
| 1,038 tons
Lowest 3%
|
|
Courthouse Place
46 64 W Hubbard St
| Office | 11.1 kg/sqft
Highest 24%
| 1,187 tons
Lowest 14%
|
|
300 E Randolph
🚨
300 E Randolph
| Office | 11.1 kg/sqft
Highest 24%
| 24,655 tons #11 Highest
|
|
8411 S HOLLAND RD
8411 S HOLLAND RD
| Retail Store | 11.1 kg/sqft
Highest 24%
| 1,291 tons
Lowest 19%
|
|
6000 6038 N CICERO AVE
6000 6038 N CICERO AVE
| Multifamily Housing | 11.1 kg/sqft
Highest 24%
| 2,499 tons
Highest 39%
|
|
Lawrence House
1020 W LAWRENCE AVE
| Multifamily Housing | 11.1 kg/sqft
Highest 24%
| 2,092 tons
Highest 49%
|
|
Reid Murdoch Center
315 - 331 N LaSalle St
| Office | 11.1 kg/sqft
Highest 24%
| 3,715 tons
Highest 24%
|
|
Lake Shore Plaza
445 E Ohio St
| Multifamily Housing | 11.1 kg/sqft
Highest 24%
| 4,590 tons
Highest 18%
|
|
Cook County Department of Corrections Campus
🚨
2700 S California Ave
| Prison/Incarceration | 11.1 kg/sqft
Highest 24%
| 50,507 tons #5 Highest
|
|
Target, Chicago Near North (0942)
2656 N Elston Ave
| Retail Store | 11.0 kg/sqft
Highest 24%
| 2,042 tons
Lowest 50%
|
|
(IL298) - 1555 Astor Condo
1555 N Astor St
| Multifamily Housing | 11.0 kg/sqft
Highest 24%
| 3,393 tons
Highest 26%
|
|
330 W Webster Ave
330 W Webster Ave
| K-12 School | 11.0 kg/sqft
Highest 24%
| 2,557 tons
Highest 37%
|
|
111 N Canal
111 N Canal St
| Office | 11.0 kg/sqft
Highest 24%
| 10,767 tons
Highest 5%
|
|
Park West Condominium
444 W FULLERTON PKWY
| Multifamily Housing | 11.0 kg/sqft
Highest 24%
| 2,118 tons
Highest 48%
|
|
Whitney Young -CPS
211 S Laflin St
| K-12 School | 11.0 kg/sqft
Highest 24%
| 4,716 tons
Highest 17%
|
Data Source:
Chicago Energy Benchmarking Data